Colloidal Stability & Shelf-life
In 1994, Formulation pioneered the development of the Turbiscan™, using the patented Multiple Light Scattering technology. And it became internationally-recognized as the first instrument that is capable of analyzing concentrated dispersions without sample preparation/dilution.
Formulaction’s Turbiscan™ is an instrument used for the detection and determination of various types of destabilization phenomena that occur, in an early stage, in emulsions, suspensions, pastes or foams. Turbiscan can therefore help chemists to quickly and accurately develop the best formulations, and to correct non-optimized formulations.
![]()
Formulaction’s Turbiscan™
The Turbiscan is designed to accelerate, by 50 times faster than the naked eye, the ageing test for a deep understanding of destabilisation mechanisms (creaming, sedimentation,flocculation, coalescence). It also documents the ageing test. In addition, with the option of thermal acceleration, the Turbiscan is able to accelerate sample ageing up to 200 times faster than at room temperature.
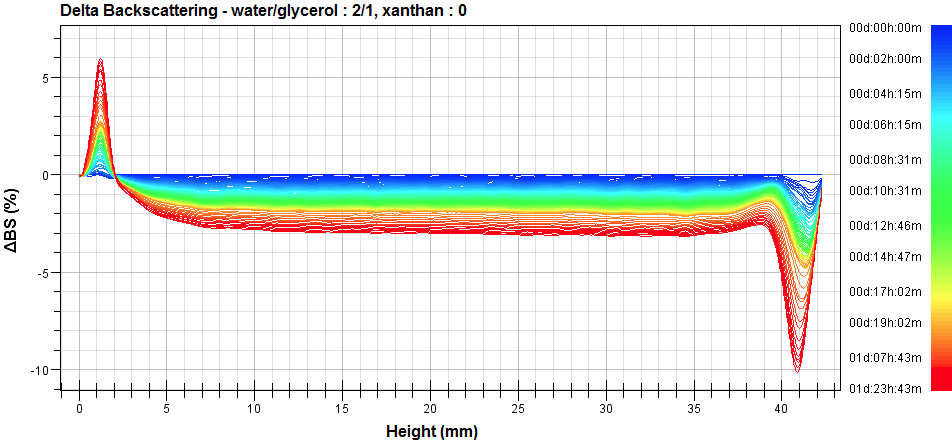
Changes in terms of size and phase separation (such as creaming, sedimentation, flocculation or coales¬cence) are directly monitored, in realistic (non-contact) conditions enabling faster and more relevant characterization compared to common methods such as visual observa¬tion or centrifugation, which are time-consuming or non-realistic. Thanks to the Turbiscan Stability Index (TSI), determination of the shelf-life and stability of formulated products has never been easier! It just takes one click to rank and compare all your samples.
How it works
The Turbiscan reading head consists of a pulsed near infrared light source (880nm) and two synchronous detectors:- The transmission detector monitors light transmitted through the product
- The backscattering detector measures the light backscattered by the product (135°).
The reading head acquires transmission and backscattering data either at a chosen position on the sample cell, or at every 40 microns while moving along the 55mm cell height. This fingerprint of the product characterizes its homogeneity, phase thickness, and mean particle diameter.
Results are represented on the software screen by a curve showing the percentage of backscattered or transmitted light as a function of the sample tube length (in mm). The acquisition scan is then repeated over and over with a programmable frequency and results are superimposed on a time scan graph. The stability or instability of the product can then be determined by analyzing the time graph. If the scans at different times overlap, the product is stable.